


Reports
On this page you can visualize different kind of reports related with the sales, employees, money, deposits and expenses and stock.
All displayed reports can be emailed as a comma-separated file (CSV) or be printed onto an AirPrint enabled printer. This allows you to import and treat your data in any calculation software (Numbers, MS-Excel, …)
Taping on any column-header will sort the table in alphabetical or numerical order. Taping again inverts the sorting order.
After applying a filter you can reset that filter by taping »Reset filter».
At the entry page, it displays an overview :
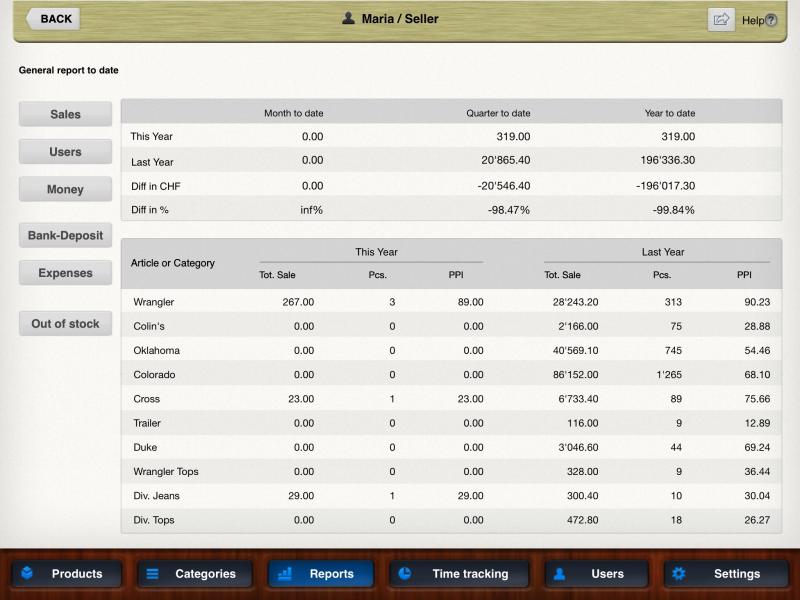
Top
A comparison from the sales divided into month/quarter/year.
Bottom
A comparison of sales from this year to last year using the categories you created. It calculates also the average Price Per Item (PPI) from every category.
On the left side you can choose from the following buttons :
Sales
Displays all sales-related information in pre-defined time frames (today, month, quarter, year) or using an individual time frame. The displayed report can be filtered by category, title or seller in order to only show all sales from a chosen category, product name or seller.
Employee
Displays all user-related information in pre-defined time frames (today, month, quarter, year) or using an individual time-frame. The displayed report can be filtered by user-name in order to only show you all sales from a chosen user.
If you are using »Time tracking», then this report calculates an average »Sales per hour» showing the user’s efficiency. Filtering this report by user name will show the performance of this user at the total line. Unfiltered, it displays the performance of the whole sales team.
Money
Displays all money-related information in pre-defined time frames (today, month, quarter, year) or using an individual time-frame.
Each table displays first the »Date», then the amount of »Cash» sales, then the payment-options you defined in »Manage Cashy > Settings».
The column »Tot. cards» displays the total of all user-defined payment-buttons.
It is followed by the amount you took out of the drawer for »Bank deposit»
Then it displays the total »Expenses» (money you took out of the drawer to buy some stuff, e.g. pencils or …)
The column »Cancelled» displays the total of all cancelled transactions. It helps you to see if out-of-ordinary cancelled transactions were done this day.
The column »Discount» gives you the total of discounted transactions using the »% on category» or »% on subtotal» – buttons on main screen.
The »Tax» column is a total of all VAT collected this day
»Total Sales» shows the sum of »Cash» and »Tot. cards»
Bank Deposit
Displays all deposit-related information in pre-defined time frames (today, month, quarter, year) or using an individual time-frame. In order to register a bank deposit, use the »Cash flow»-function on the main screen
Expenses
Displays all expense-related information in pre-defined time frames (today, month, quarter, year) or using an individual time-frame. The table shows you the date, particular name and the amount of the expense. In order to register an expense, use the »Cash flow»-function on the main screen.
Out of stock
Displays all products where »Stock» value is equal or less then the »Minimum stock» value defined in »Products». Using the search field on top right of the screen will filter the product list shown.
Overview page (stand-by screen) when accessing »Manage Cashy». This screen can be turned OFF under »Manage Cashy > Settings > Extra»
Here you get a short overview containing the statistic with the following data:
Sales today: All sales since the last close-day-event
Hours this month: Hours worked this month (data comes from “Time tracking”)
Hours today: Hours worked today (data comes from “Time tracking”)